Introduction
The Customer Portal and Staff Portal Reports provide overview information regarding aspects of product usage. The data contained within is designed to provide more limited, at-a-glance information. Where applicable, please utilize Realtime Reporting to produce more detailed local reports.
Accessed from Customer Portal Admin > Reports
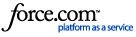
Portal Statistics
The Statistics page displays a pie chart to show the percentage of registered users who are self-registered compared to CSA-registered. The data is automatically created.
top of page
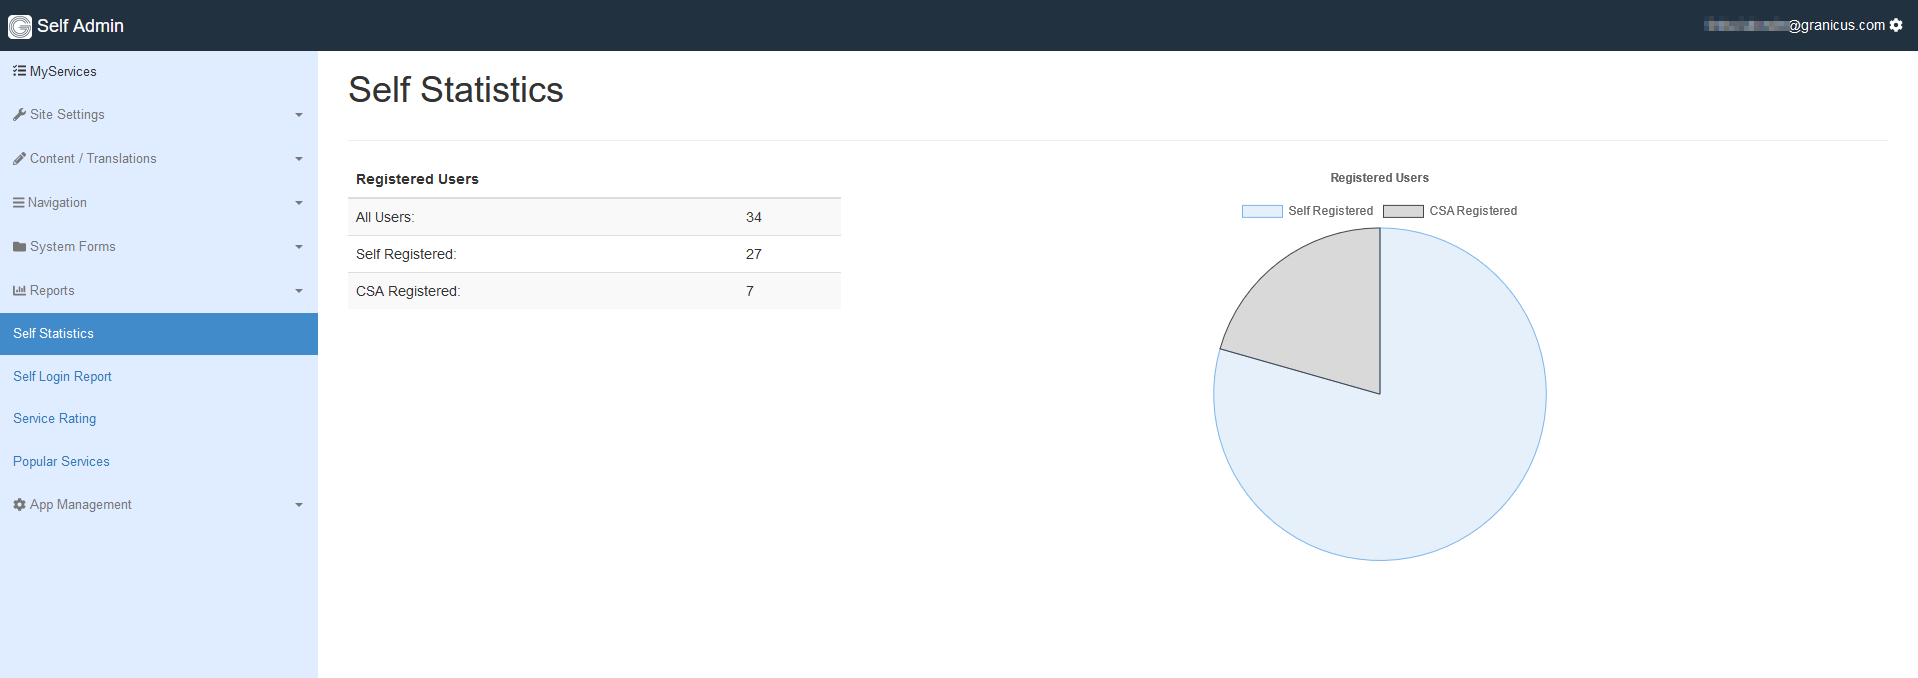
Portal Login Report
The Login Report provides user details. These include User Id, User Email, Last Login, Auth Type, Product, Verified.
The potential authorization types are FAM or SSAUTH.
* FAM logins are Office login types.
* SSAUTH logins are logins via Customer Portal. This includes Web logins.
* GoogleFAM is specific to govService logins.
top of page
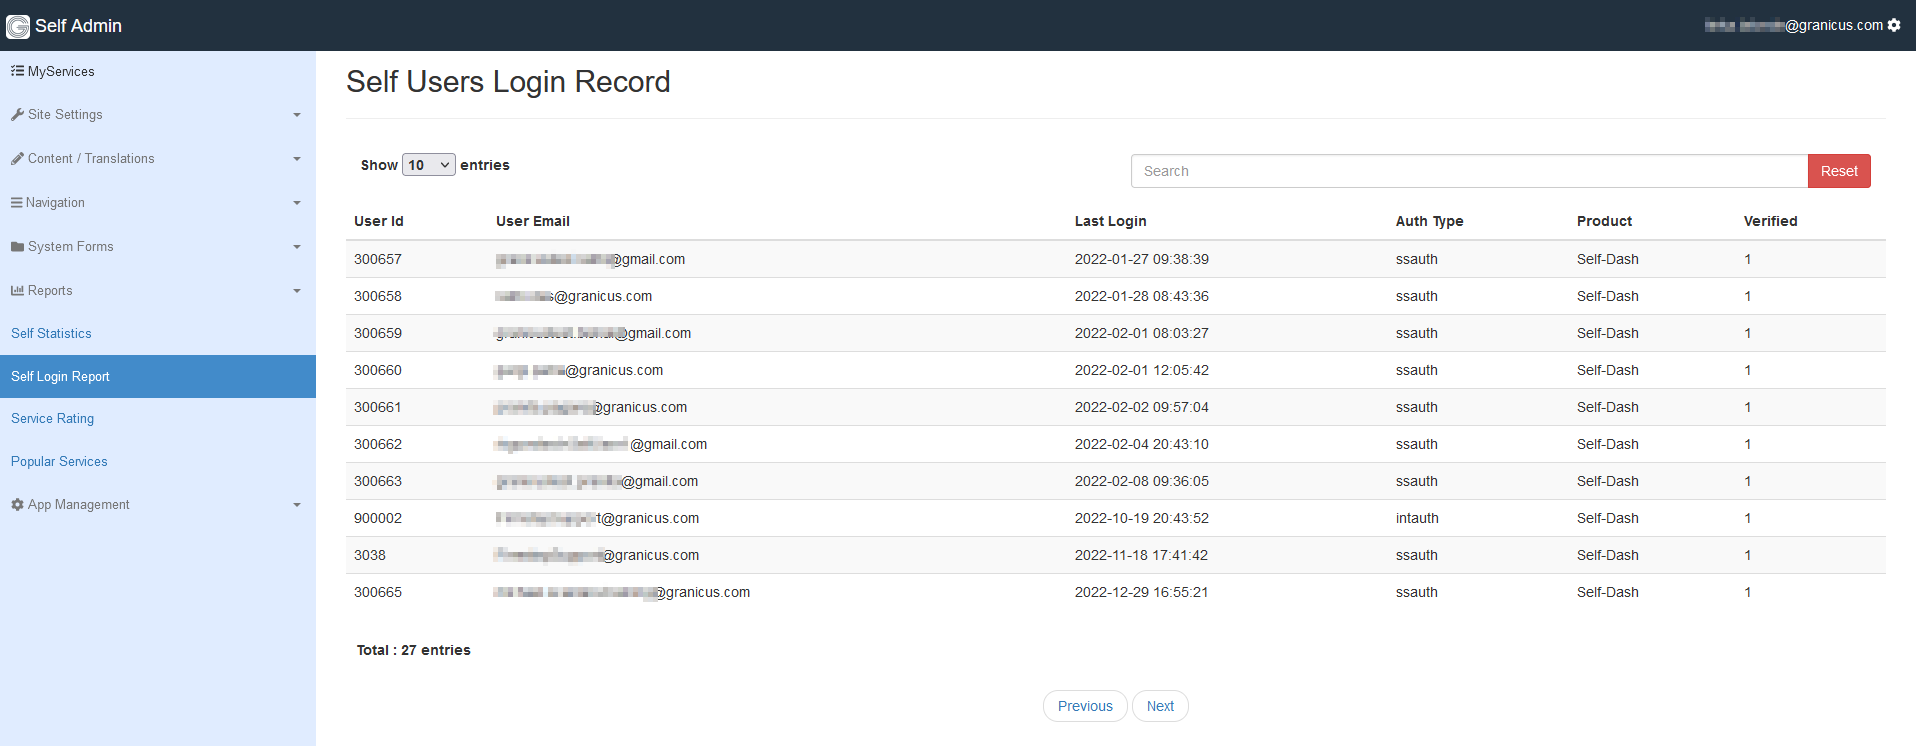
Service Rating
The Service Rating section displays information from the service ratings entered by site users.
In the list below, the number associated with each point corresponds to a red number in the following image of the govService page.
- From the drop-down menu at the upper left of the listing, you can select individual Forms to see how the users have rated them. Selecting a Form will cause the bar chart to reflect the data related to that Form.
-
The bar chart in the main body of the page reflects the number of users that have chosen each star level for the selected Form.
-
You can narrow the information in the report to a specific time period. You can either enter the dates manually or click on the Start Date or End Date field to display a calendar from which to select a date. Selecting a time period will adjust the bar chart to reflect the selected information. Note: If you experience issues with any date periods not being displayed correctly in the bar graph, the data will still be reflected accurately when exporting the report.
-
The report will by default show only the values for service ratings for the Portal in which you are currently working (Staff or Customer). It will not include information related to the other Portals. In order to display values for all Portals, select the checkbox associated with the All Product Ratings option.
-
To export the selected information as a .csv file, select the blue button displaying icon utilizing a down arrow with a rectangle. This is the download icon.
-
To reset the date fields, select the X button.
-
Displayed below the bar graph are details about each Service Rating. These include Date, Form, Rating, and Comment. By default, only 15 are shown. If more than 15 comments have been made, a note will display above the list, inviting you to download the results to see all of them.
top of page
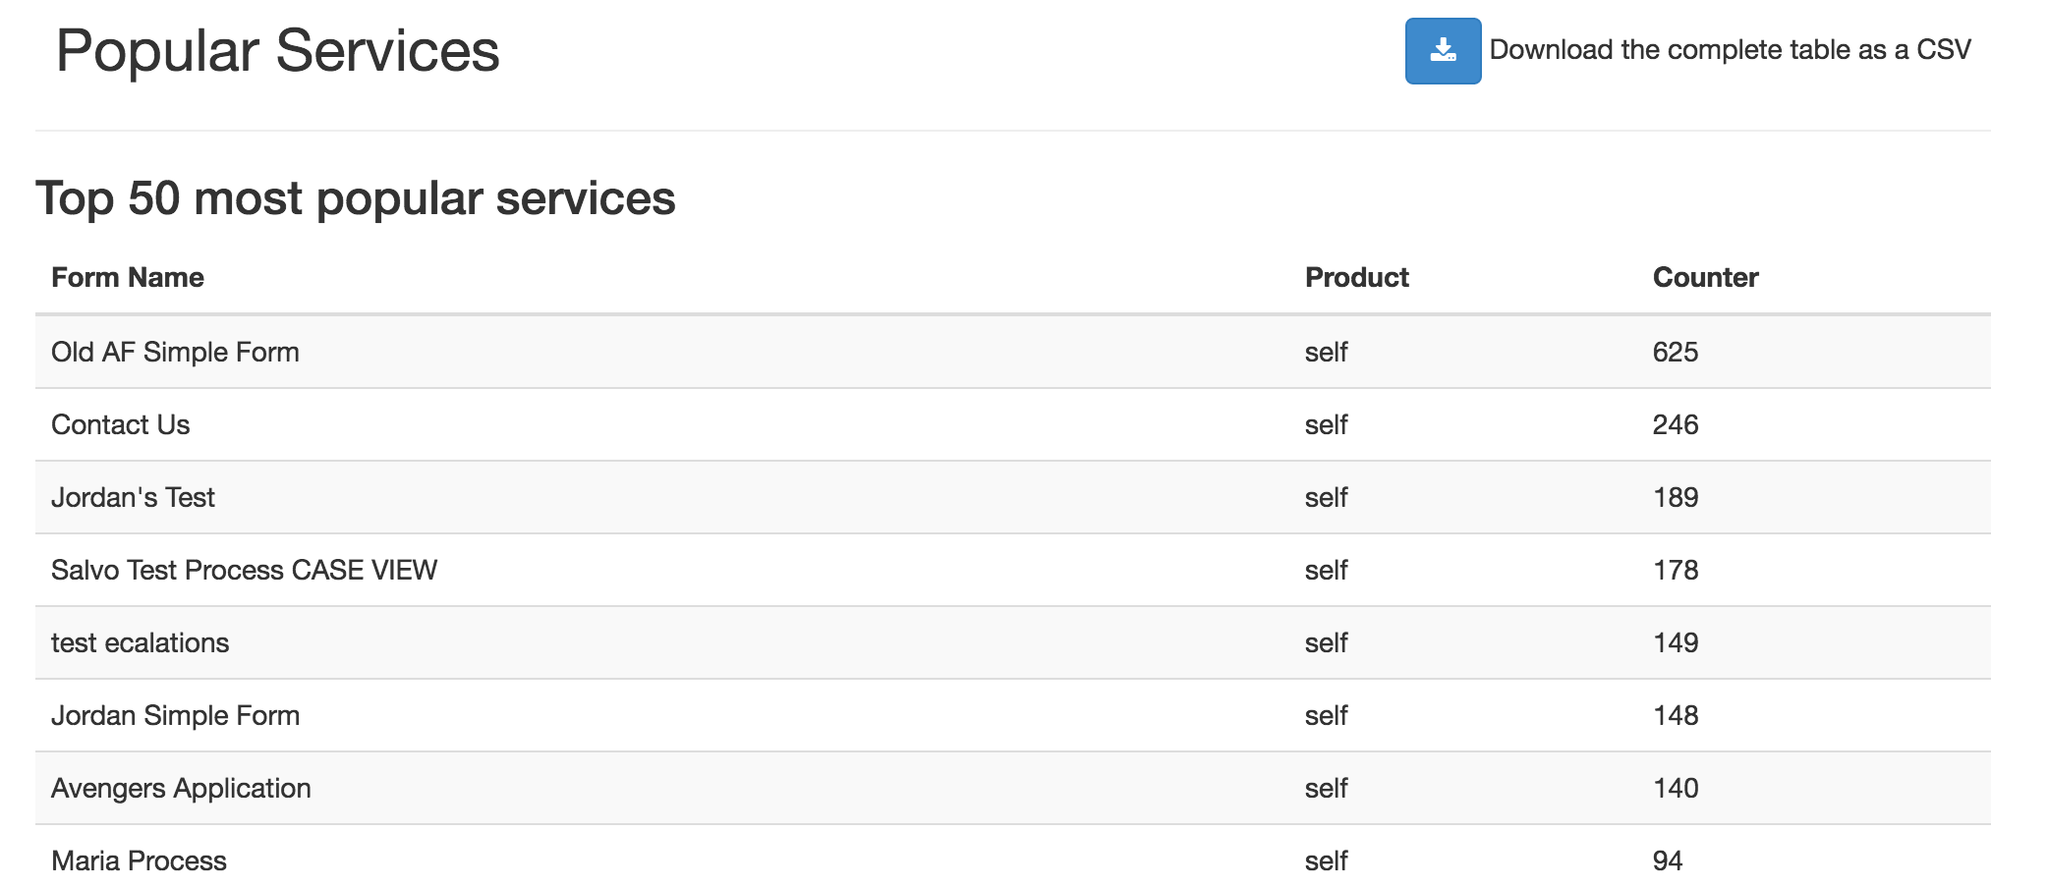
Popular Services
The Popular Services section displays the most popular Forms selected by users of the Portal in which you are currently working rather than all submissions through all channels. In other words, a submission that starts in a Portal other than the one currently being utilized is not recorded as part of this report.
In order to view how many clicks each published Form on your site has received, you can download the .csv file.
In the .csv file:
- The "Click" column represents the number of times that a process has been accessed by the current Portal.
- The "Submit" column displays the number of times that the process has been initiated on the current Portal.
Top of Page
top of page