This feature is part of the govDelivery Advanced Package. If your organization is interested in accessing this advanced feature, submit a request or contact your Customer Success Consultant.
In govDelivery, custom drip campaigns let you automate sending a collection of messages to audiences segmented by interest, location, or engagement activity. This powerful tool helps your organization improve communication effectiveness and corresponding key objectives. A report is provided for each custom drip campaign to help you measure this impact.
A drip campaign report becomes available when you activate a custom drip campaign and at least one campaign message is sent to at least one subscriber. Note that if you delete the campaign, the report will also be deleted.
Accessing Custom Drip Campaign Reports
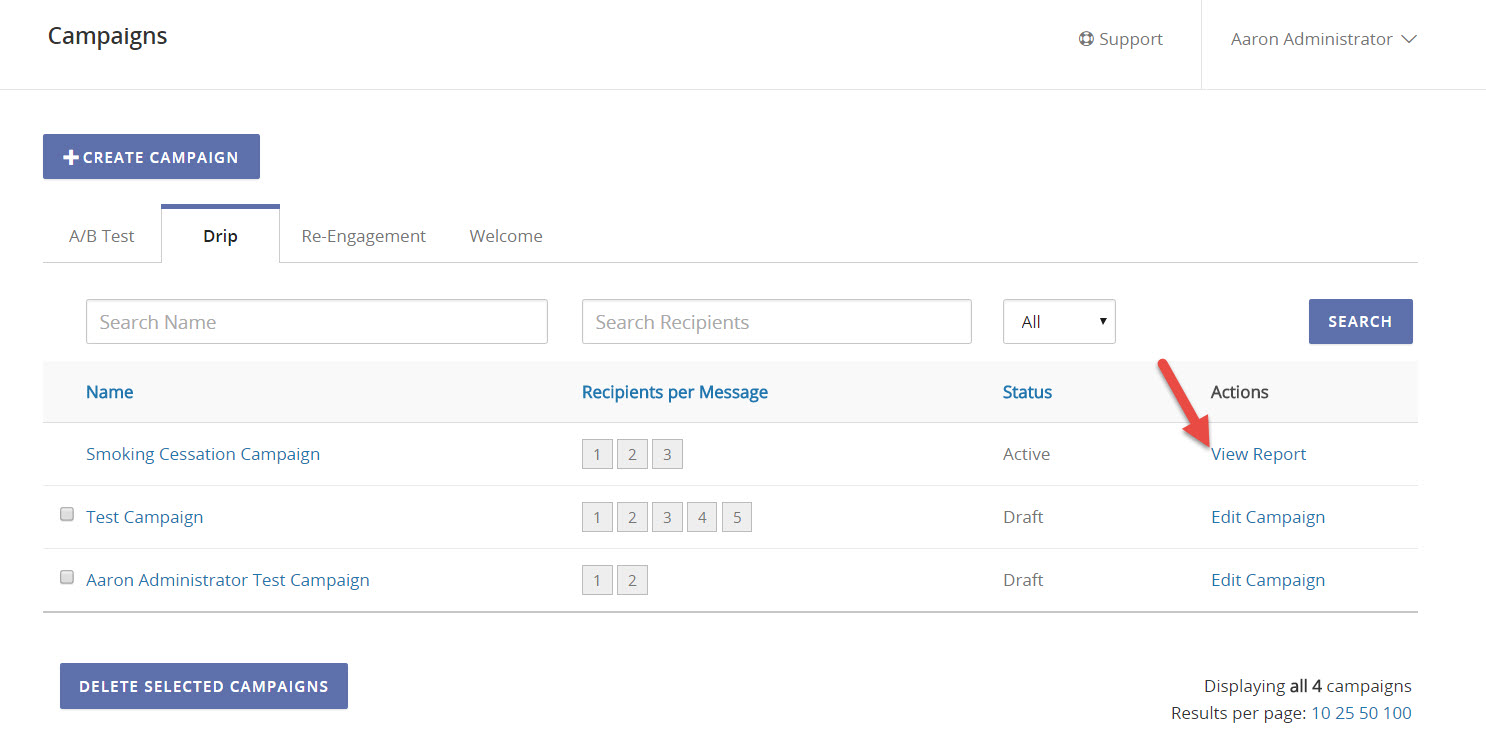
You can access these reports from the main Campaigns list, by clicking Campaigns in the left navigation, selecting the Drip Campaigns tab, and then following the link in the Actions column for a particular drip campaign.

You can also go to the Reports page and click Campaign under Bulletin Reports.
Reading the Report
A drip campaign contains one or more campaign messages. Every time the campaign message is sent, a copy of the original bulletin used for that message is made. This means that every time a campaign message is sent, it is tracked as a separate bulletin, even though the content is generally the same each time (note that you can pause a campaign, edit the content for a campaign message, and re-activate the campaign).
govDelivery provides metrics for each of these levels. The hierarchy looks something like this:
- Campaign
- Campaign Message 1
- Bulletin (11/4/15 7am)
- Bulletin (11/11/15 7am)
- Campaign Message 2
- Bulletin (11/9/15 2pm)
- Bulletin (11/16/15 2pm)
- Bulletin (11/23/15 2pm)
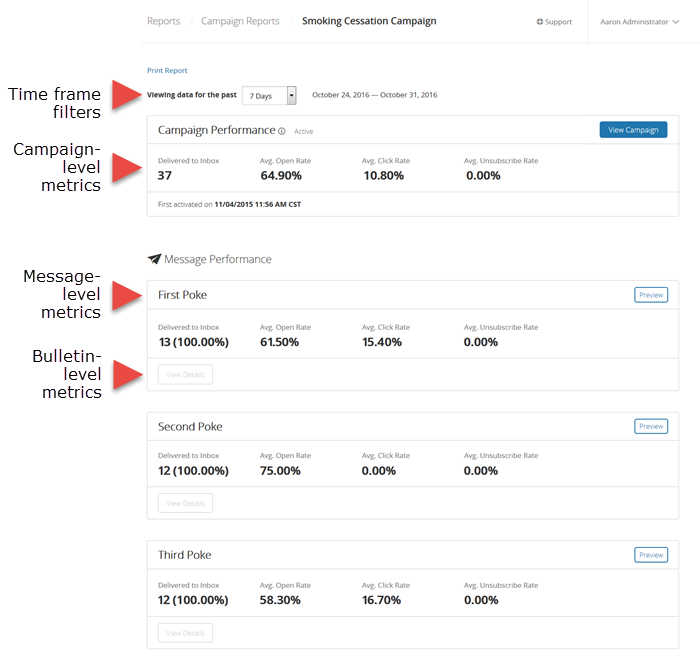
A drip campaign report provides analytics for the first two levels of this hierarchy and makes it easy for you to quickly drill down for bulletin-level metrics. The report contains the following main elements:

Time Frame Filter
All data on the report is filtered based on the selected time frame--this includes campaign-, message-, and bulletin-level detail. The report will display up to the last 120 days' worth of data. For information beyond this length of time, you can view bulletin-specific reports.
Campaign-Level Metrics
This data in this section is rolled up across all bulletins for every campaign message within the time frame selected at the top of this report. It lets you see at quick glance how effective your custom drip campaign has been to this point.
Message-Level Metrics
You can see delivery and engagement data for each campaign message in the sections of the report with a green header. Each message gets its own section. This sections rolls up data across every date and time this message is sent (as a new bulletin) within the time frame selected at the top of the report. You can use the Preview button to see the message.
Bulletin-Level Metrics
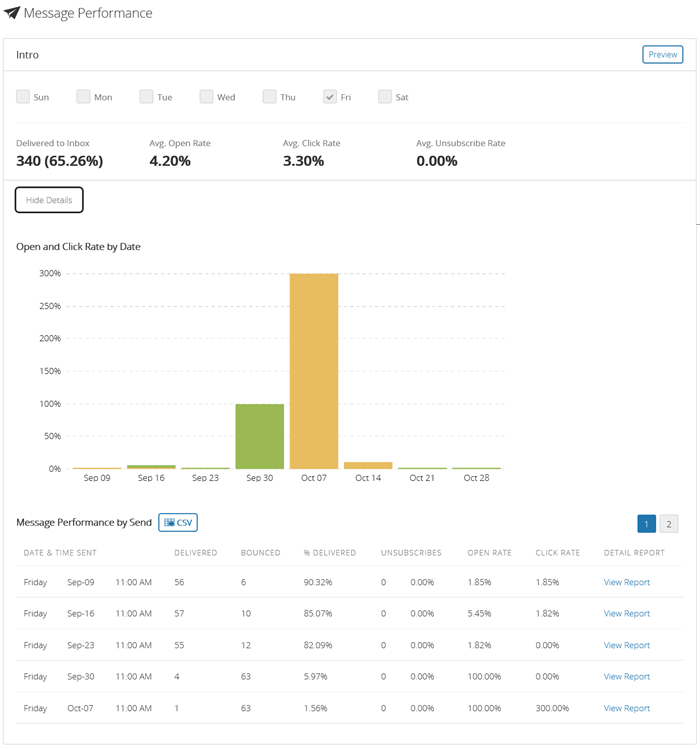
You can click View Details to expand the report for a given campaign message. This shows all instances of the message (bulletins) that have been sent within the time frame selected at the top of the report.

The graph shows open and click rates per day. The green and yellow bar combined make up the open rate, while the yellow portion is click rate only. Below the graph you can find a list of all bulletins sent for this campaign message. You can drill into each individual bulletin by clicking its View Report link.
Understanding Report Data
The following data points appear in the campaign-level and message-level sections of the report:
- Delivered to Inbox: The total number of recipients who successfully received a bulletin within the time frame selected at the top of the report. This includes all wireless and email messages.
- Average Open Rate (%): The average number of recipients who open a bulletin sent as part of this campaign within the time frame selected at the top of the report. For the open to be recorded, the embedded web beacon included in the bulletin must render. Therefore, this value does not reflect bulletins opened in text-only email clients or many wireless devices. Only the unique opens are counted (i.e., if a recipient opens the bulletin three times, only one open will be counted). This percentage is taken out of only the successfully delivered bulletins.
- Average Click Rate (%): The percentage of recipients that clicked at least one link in a bulletin--within the time frame selected at the top of the report.
- Averaged Unsubscribe Rate (%): The percentage of recipients who unsubscribed from your account using the one-click unsubscribe link found in the standard footer of a message delivered with govDelivery. Note that your organization has the option of customizing your message footers and excluding this link. For more information about one-click unsubscribe, see Macros.
The following data points appear in the bulletin-level metrics section:
- Date & Time Sent: The date and time the bulletin began sending to recipients
- Delivered: The number of bulletins successfully delivered to the recipients' inboxes; includes all email, wireless, and digested message recipients.
- Bounced: The number of messages that failed to be successfully handed off to the recipients' servers.
- % Delivered: The percentage of bulletin successfully delivered to the recipients' inboxes.
- Unsubscribes: The total number of recipients who unsubscribed from your account using the one-click unsubscribe link found in the standard footer of a message delivered with govDelivery. Note that your organization has the option of customizing your message footers and excluding this link. For more information about one-click unsubscribe, see Macros.
- Open Rate: Percentage of recipients who open the bulletin.
- Click Rate: The percentage of recipients that clicked at least one link in the bulletin.
Exporting Your Report
You can export your report to a printable view, generating a paper copy or storing a digital copy to your hard drive--if you have the capability to print to a PDF.
To export your report, click Print Report at the top of the page.


