This feature is part of the govDelivery Advanced Package. If your organization is interested in accessing this advanced feature, submit a request or contact your Customer Success Consultant.
When you initiate an A/B testing campaign in govDelivery, the campaign tracks subscriber engagement with your test bulletins, providing insights into your audience's communication preferences and valuable data to help you make design and messaging decisions. In addition to our standard bulletin-level reports, we also provide campaign-level reports with A/B testing.
Accessing A/B Testing Campaign Reports
You can access these reports from the main Campaigns list, by clicking Campaigns in the left navigation, and then following the link in the Actions column for a particular testing campaign.
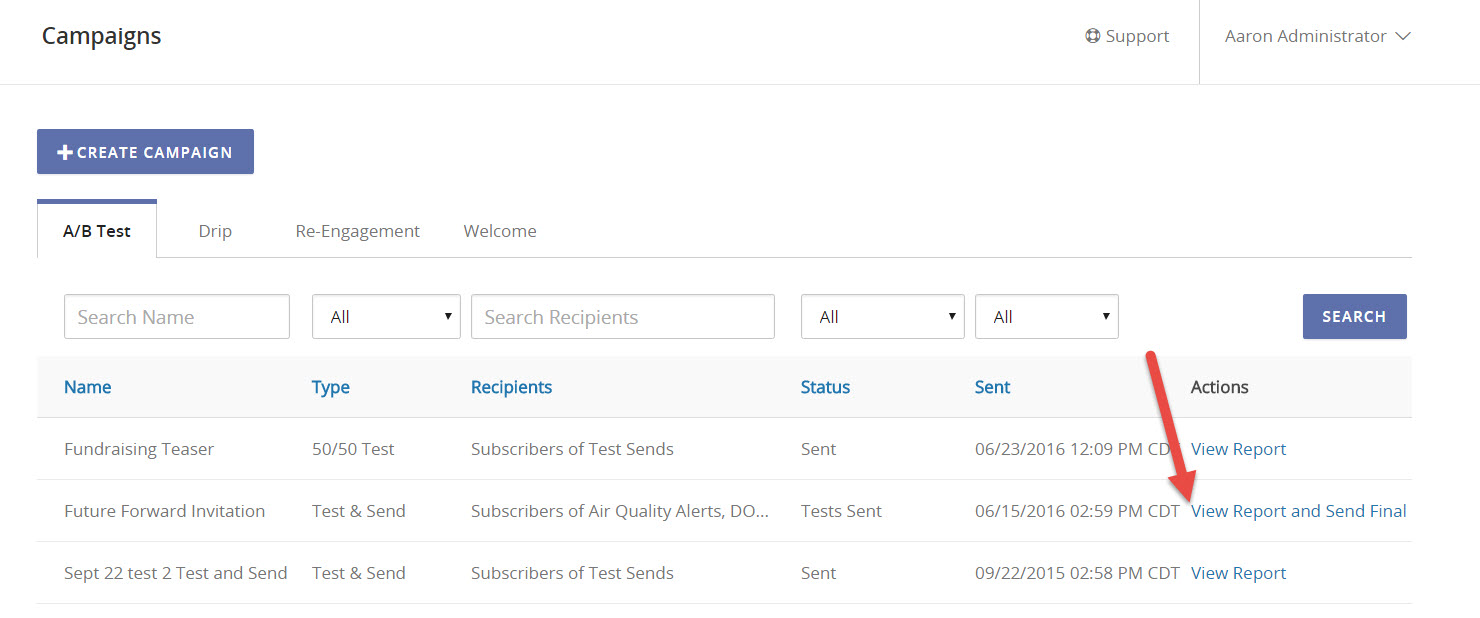
You can also go to the Reports page and click Campaign under Bulletin Reports.
Understanding the Report Life Cycle
In govDelivery, A/B testing campaigns have a life cycle: Test bulletins are sent, data is gathered, and then the testing is completed and some automated actions might take place. This life cycle begins when tests are sent and progresses through the following stages.
Unavailable
When you start a new testing campaign, the campaign begins to send your test bulletins to the recipient list you defined for the campaign. During this time, campaign and associated bulletin reports aren't available.
In Progress
After the test bulletins are sent to your recipients, the campaign tool collects subscriber engagement data for each test bulletin. This period lasts for a set length of time, depending on the type of A/B testing campaign. During this time, you can view campaign and bulletin reports. Note that the campaign will continue to add new engagement data until the end of the testing period. You can refresh the reports to see the most current data.
Final States
The subsequent states of the report depend on the type of campaign you ran.
For 50/50 Campaigns
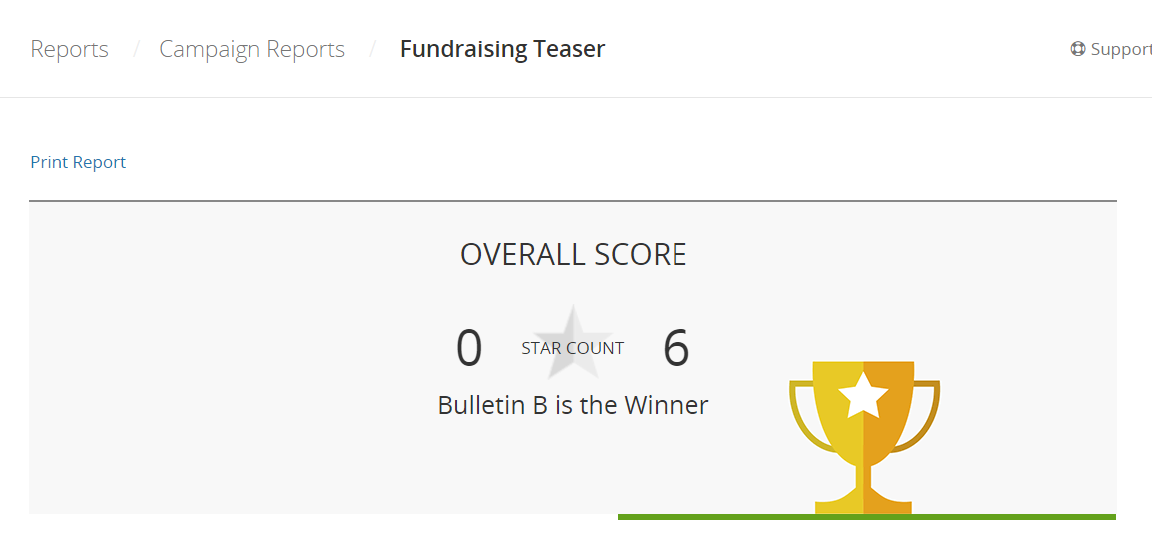
When the testing phase is done, the campaign report reaches a final state and displays the winner (or indicates if there was a tie).
For Test and Send Campaigns
In addition to a testing phase, Test and Send campaigns also include a final bulletin that must be sent.
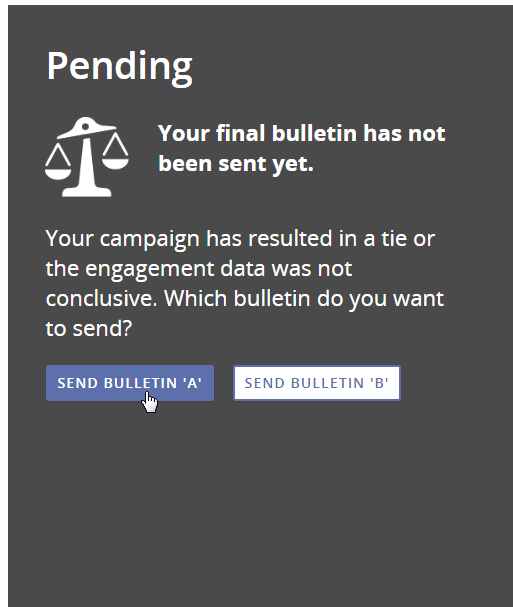
- Final Pending — If you ran a Test and Send Campaign where you chose to manually select and send the final bulletin, the report will be held in a "pending" state until you send the final bulletin. The report will collect subscriber engagement data for four hours. The report will indicate when the testing phase is done by either selecting a winner, or letting you know it resulted in a tie. If you ran a fully automated Test and Send campaign, this state is skipped.
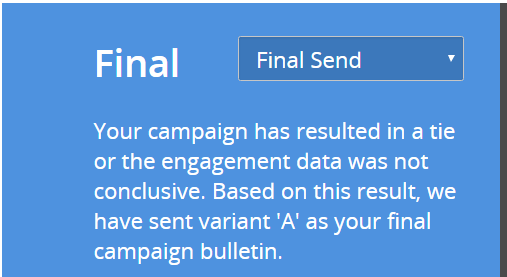
- Final Sent — The left column of the report will indicate that the final bulletin has been sent by changing to blue. The text will tell you whether this bulletin was sent automatically or manually.
Report Data During the Final States
After the testing period ends for 50/50 campaigns, the data in the campaign report is locked, showing only the subscriber engagement data collected within the testing phase. For Test and Send campaigns, the engagement data for the test bulletins is similarly locked, however, the report continues to receive engagement data for the final send.
The bulletin-level reports continue to be updated beyond the testing phases, providing you with the most up-to-date engagement data. See Using Reports to Track Communication Effectiveness.
Reading A/B Testing Campaign Reports
The campaign report for 50/50 campaigns and Test and Send campaigns contain the same data, but are laid out in slightly different manners. This section provides some general tips for reading and understanding the reports. The data points in each report are detailed later.
In the reports for both campaign types, each test bulletin is given its own column. These columns contain information about the bulletin, as well as delivery and engagement metrics. The report for Test and Send campaigns also contains an additional column on the left side that lets you see campaign totals and information about the final bulletin that is sent after the testing phase.
Each report contains the same main elements.
Report Status
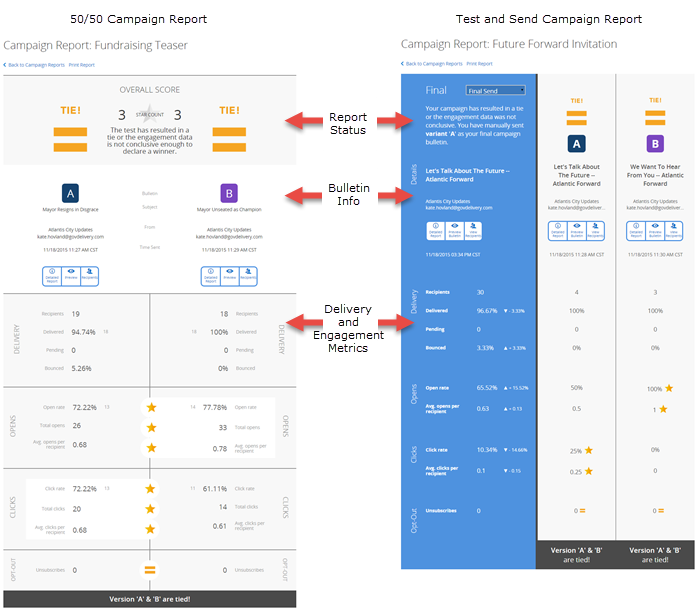
The 50/50 campaign report provides status information at the top of the page, while this information can be found at the top of the leftmost column for the Test and Send campaign report. This section will indicate if the testing phase of the campaign is still in progress or if it has ended. If testing is over, it will tell you the winning bulletin or indicate that there was a tie. If you chose to manually send the final bulletin for a Test and Send campaign, this section contains buttons that enable you to send either version as the final bulletin. For more information on manually sending the final bulletin, see Running a Test and Send Campaign.
Bulletin Information
This section contains information about each test bulletin, such as subject line, topic, from address, and the date and time sent. It also includes the following links:
- Preview (or Preview Bulletin) — Click to see a preview of the bulletin. This is helpful if you can't remember what is different between the versions and need a reminder of how each bulletin looks.
- Detailed Report — This link takes you to the Bulletin Detail Report for that bulletin. The Bulletin Detail report contains delivery and engagement information collected for this bulletin from the time it was sent to the present. Unlike the Campaign report, the Bulletin Detail report does not stop collecting data when the testing phase ends. For more information, see Bulletin Detail Report.
- Recipients (or View Recipients) — This link takes you to the Bulletin Address Report, with in-depth information on the audience of this bulletin, including a list of recipients.
Delivery and Engagement Metrics
This section contains delivery stats for each test bulletin as well as engagement metrics broken out by opens, clicks, and one-click unsubscribe behavior. In a 50/50 campaign report, any data point measured in percentages in this section also contains the actual numbers next to it. For definitions of each metric, see Referencing Report Data.
Understanding Final Send and Campaign Totals
When the final bulletin has been sent for a Test and Send campaign, the leftmost column turns blue. This column then contains information for the final sent bulletin. Use the drop-down menu in this section to toggle between:
- Final Send - The left column will show data for the final bulletin send only--or in other words, all bulletins sent after the testing phase ended.
- Campaign Totals - The left column will show data for the campaign as a whole--averages for every bulletin sent for this campaign, either during the testing phase or the final send. Note that this column does not include any engagement data for the test bulletins that occurs after the testing phase has ended.
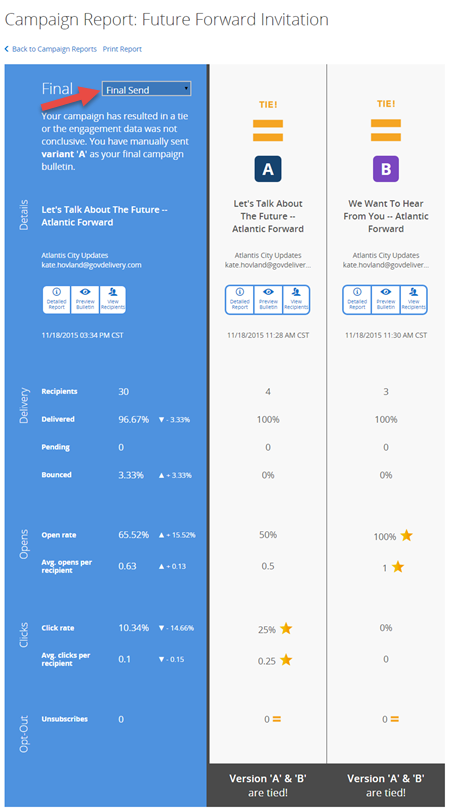
To see a definition for any data point in this column, see the next section in this article. Deltas are listed next to each data point to show the difference in engagement and delivery between the winning bulletin's performance during the testing phase vs. either the final send or the campaign as a whole (Campaign Totals).
For example, the image below shows a Test and Send campaign where bulletin B was deemed the winner and sent as the final bulletin. The left section is toggled to Campaign Totals.

You can see that the open rate for bulletin A during the testing phase was 11.46%. The open rate for this campaign as a whole, including all test bulletins and the final send, was 17.13%. The delta shows the difference between the open rate for the winning bulletin (bulletin A) during the testing phase vs. the open rate average for all bulletins sent as part of this campaign.
A/B Testing campaign reports contain the following pieces of data.
- Recipients: The number of recipients who were sent the bulletin.
- Delivered: The percentage of recipients who successfully received the bulletin. This includes all wireless and email messages.
- Pending: The number of recipients whose bulletins are pending delivery.
- Bounced: The percentage of messages that failed to be successfully handed off to the recipients’ servers.
- Open Rate: The number of bulletins opened by recipients. For the open to be recorded, the embedded web beacon included in the bulletin must render. Therefore, this value does not include bulletins opened in text-only email clients or many wireless devices. Only the unique opens are counted (i.e., if a recipient opens the bulletin three times, only one open will be counted). This percentage is taken out of only the successfully delivered bulletins.
- Avg. opens per recipient: The average number of times a recipient opened your bulletin. A higher number indicates that your recipients are opening the message multiple times, telling you that they found the content useful or needed to reference it again.
- Click Rate: The number of recipients who clicked any link in the bulletin. It is taken out of only the successfully delivered bulletins.
- Avg. clicks per recipient: The average number of times a recipient clicked any link in the bulletin.
- Unsubscribes: The total number of recipients who unsubscribed from your account using the one-click unsubscribe link found in the standard footer of a message delivered with govDelivery. Note that your organization has the option of customizing your message footers and excluding this link. For more information about one-click unsubscribe, see Macros.
Exporting Your Report
You can export your report to a printable view, generating a paper copy or storing a digital copy to your hard drive--if you have the capability to print to a PDF.
To export your report, click Print Report at the top of the page.


